LMME-DM
A customised version of LMME for disease maps.
The following guide helps you to get started quickly with LMME-DM (Large Metabolic Model Explorer for Disease Maps).
0. Requirements
- You need a current version of the Java runtime environment (JRE) installed on your machine. You can download the latest version here (for the development of LMME, we used AdoptOpenJDK 11, which also includes a JRE).
- You also need a version of the Vanted software installed on your machine. You can download it here (for the development of LMME, we used Vanted version 2.7.1).
- If you would like to use the SBGN translation feature, you also need the SBGN-ED Add-on for Vanted. You can download it as jar file from the SBGN-ED website and install it in the same way as described for LMME below.
1. Download LMME-DM
To install LMME-DM, you need its jar file, which you can either download or build yourself.
Download the jar file
You can download the current version of LMME-DM as jar file here: lmme-dm.jar.
Build the jar file yourself
Instead of downloading the jar file, you can also build it yourself from the source code. The code, as well as a description for building it yourself, is available from our Github repository.
Install LMME-DM
There are two ways to install LMME-DM. Within Vanted, either use a drag&drop operation (drag the jar file from your systems file manager and drop it inside the Vanted program window) or navigate to Edit > Preferences > Addon Manager > Install / Configure Add-ons > Install Add-on and select the jar file in the appearing file chooser.
2. First steps
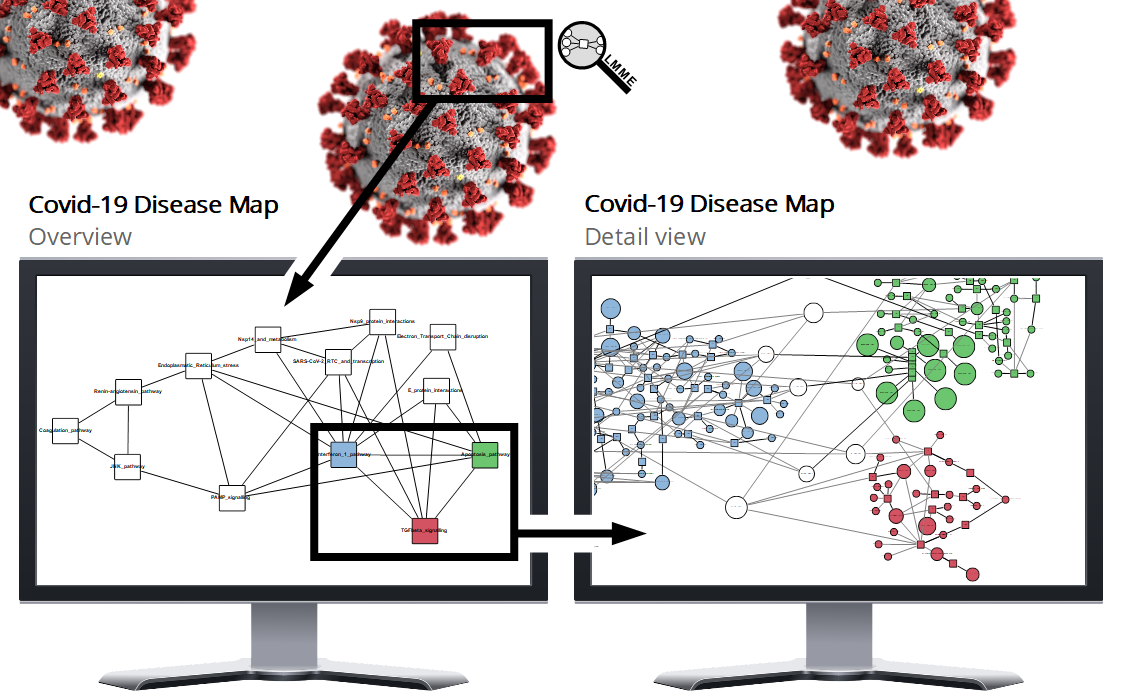
As soon as LMME-DM has been installed into your Vanted program instance, you can load a disease map for its analysis. As before, you can either do that by using a drag&drop operation (drag an SBML file from your systems file manager and drop it inside the Vanted program window) or navigate to File > Open and select the SBML file in the appearing file chooser. An example model of the COVID-19 disease map can be downloaded below.
After loading the model, navigate to the LMME-DM tab on the right and press the uppermost button Initialise Exploration. You will immediately see some general information about the disease map, appearing at the top of the tab.
You can now select a decomposition method and press the Show Overview Graph button. This computes a decomposition and shows the overview graph on the left side of the application window. For a detailed description of the individual settings, see the Learn section.
As soon as the overview graph has been constructed, you can select some of its nodes and press the Show Selected Subsystems button at the bottom of the tab to have the consolidated subsystem graph shown on the right side of the application window.
If some errors occurred during the steps described above, or if you are interested in the individual settings or additional features that have not been covered above, please have a look at the Learn section.
3. Insert Data
You can now insert data to be analysed in the context of the hierarchical disese map. To open the data mapping menu, click the button Node Highlighting at the top of the right tab. You can now insert data in plain text in the form nodelabel,doublevalue (one node per line). To map the data, click on one of the buttons below, e.g. Color in Overview to have the data mapped on the node color in the right overview panel.
The COVID-19 Disese Map as example
Here is a gml-file of the Covid-19 disease map, containing 2115 metabolites and 2303 reactions.
Here is a txt-file containing the labels and centrality values of the 100 species nodes in the Covid-19 disease map from our corresponding centrality analysis.
The development of LMME-DM and the centrality analysis was done as part of the Covid-19 diese map project. For more information, please have a look at our publication:
[publication currently under preparation]
Image attributions
As part of our teaser image, we used the following:
- COVID-19 image: from cdc on Unsplash under the Unsplash License.
- Monitor image: from clker-free-vector-images on Pixabay under the Pixabay License.
- Font: Open Sans from Steve Matteson on Google Fonts under the Open Font License.