Subsystems Analysis
Subsystems from the overview graph may be selected and investigated in greater detail. To help you identifying subsystems of interest, you can make use of the interactive part of the Session Information panel.
Consolidated Subsystem Graph
The subsystems of interest are shown in the form of a consolidated subsystem graph (CSG). To construct the CSG, every subsystem is at first transformed into its detailed network representation (metabolites, reactions, and connecting edges). If there are metabolites that occur in more than one subsystems (which are interface metabolites, showing a relationship between the subsystems), are merged into a single node, such that the graphs of the subsystems get connected to each other, to directly show the interfaces in the overall representation.
Settings
To show a CSG, you first need to select the subsystems of interest in the overview graph. In the Subsystem View panel of the LMME tab, there are several settings, which we will have a look at now.
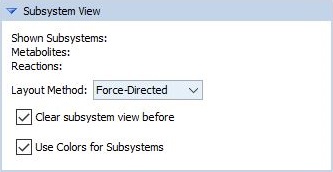
At the top of the panel, there is some information shown:
- The number of shown subsystems as part of the CSG
- The total number of metabolites contained in the CSG
- The total number of reactions contained in the CSG
It will be available as soon as a CSG is shown.
You can also choose a layout for the CSG. The available layout methods are discussed in the Layout section below.
The Clear subsystem view before checkbox controls whether the subsystem view (right part of the application window) will be cleared before the selected subsystems are shown as CSG. If ticked, only the selected subsystems will be shown as CSG, whereas if not ticked, the current CSG will be extended by adding the selected subsystems that have not previously been part of it. This allows you to successively add subsystems of interest into the subsystem view.
The Use colors for subsystems checkbox controls whether color will be used in the representations. If ticked, any subsystem node in the overview graph will be colored individually, whereas the corresponding nodes contained in the CSG in the subsystem view will be colored with the same color, to provide a visual link between these two views. The interface metabolites (metabolites that connect different subsystems), however, will remain uncolored, to highlight their special role within the CSG.
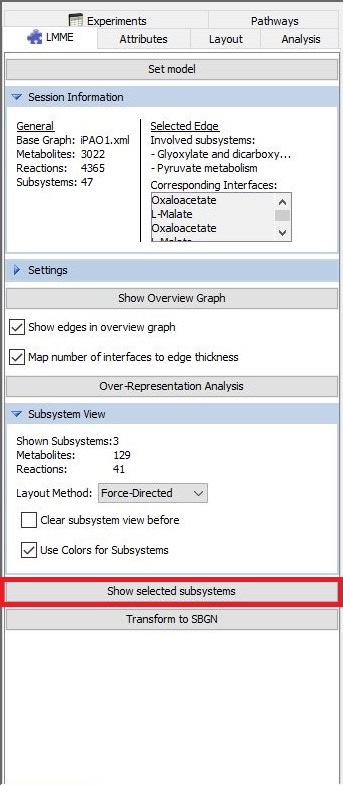
To finally show the CSG, just press the Show Selected Subsystems button. The CSG will then appear in the subsystem view (right part of the application window).
Layout
There are several available layout methods than can be used for the visualisation of the resulting overview graph. We will give a short description of them in the following.
- Force-directed Layout
At the moment, LMME uses the implementation of the Spring Embedder, that is available in Vanted. The main idea is to use a physical analogy to create a visually appealing drawing of a graph. Physical forces are assumed in two ways: attractive force between adjacent vertices and repulsive forces between any pair of vertices. Node movement according to these forces is then computed iteratively until a force equilibrium is reached. See the publication below for more details.
Eades, P. (1984). A heuristic for graph drawing. Congressus numerantium, 42, 149-160.
The next two layout methods make use of the bipartition of the CSG into metabolites and reactions.
- Bipartite Layout
All the reaction nodes are placed on an imaginary vertical line. The same holds for the metabolite nodes, whereas their imaginary line is placed in parallel to the former one. Nodes on both lines are then re-ordered according to a heuristic in order to minimise their crossings.
- Circles Layout
All the reaction nodes are placed on an imaginary circle. The same holds for the metabolite nodes, and both circles are arranged concentrically. Again, nodes on both circles are then re-ordered according to a heuristic in order to minimise their crossings.
SBGN Translation
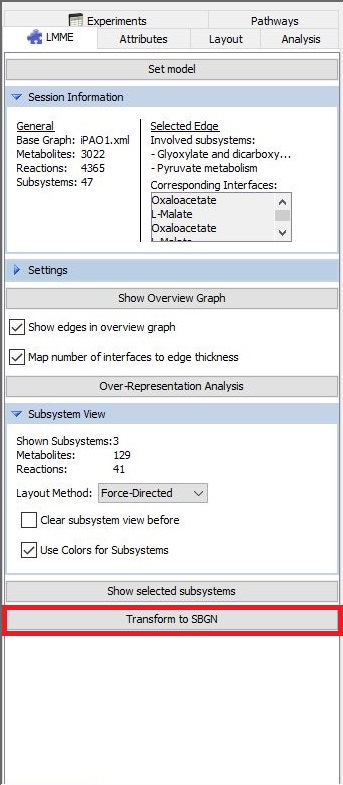
As soon as a CSG has been constructed, there is the possibility to translate it into the Systems Biology Graphical Notation (SBGN), a visual standard in the Systems Biology community.
Please note that this feature also requires an installation of SBGN-ED, which is another Add-on for Vanted. For more information on download and installation of this Add-On, see the Getting Started section.
To perform the translation, you just need to click on the Transform to SBGN button in the LMME tab.