Template 1
It is recommended, to use one of the available example files as the starting point for entering your own data, or to save and open the template, available from the Experiments-side panel. It is important not to insert rows or columns at places where it is not supported by the system. Also the data format of the input needs to be valid, fields which are not marked to be optional, need to contain data. If all is set-up correctly, the data loading will be a easy one-step process. If you still experience problems in loading your experimental data, please contact the author of this system.
A possible layout of the input data which VANTED does support with the processing of template 1 is shown in the following picture:
Layout of the Excel input form
The layout of the input form was designed to ease the transfer of measurement data out of analysis software, which most times allows the export of the measurement values in the form of an simple Excel table. It is often possible to directly copy these lists of measurement values into the input form. Sometimes it may be necessary to transform the data table (exchange rows with columns). This is easily possible with the corresponding menu command ("Paste special...") in the Edit menu. Additionally reference data about the experimental setup and the analyzed plants/genotypes needs to be entered in the input form. An overview of the input form is given in the following picture:
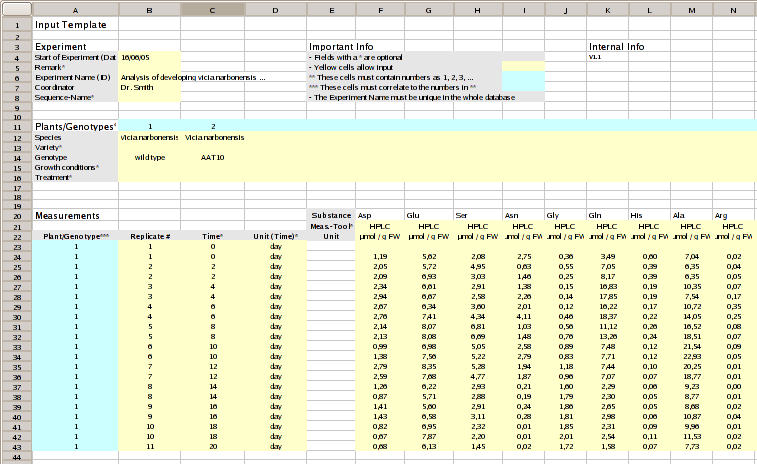
At the top of the form the reference info needs to be entered. Below the analyzed plants/genotypes are listed in separate columns. Then the measurement values with a reference to the analyzed plants/genotypes and a optional time information may be entered in columns A, C, D. As it is possible to process replicates the column B should contain the reference replicate number. From column F on the analyzed substances and its measurement values are stored in the input template. In the following the 3 main parts of the input template are described in more detail.
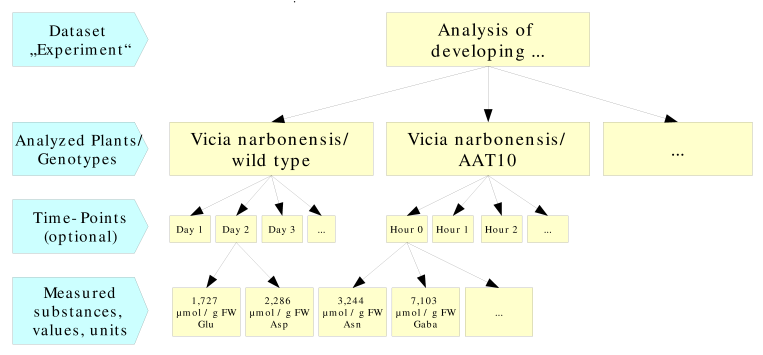
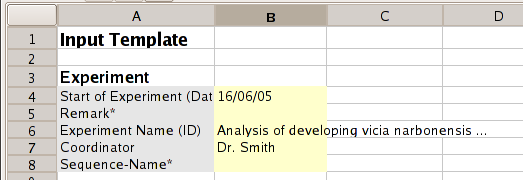
Dataset ("Experiment") description
The data input for a hypothetical experimental dataset "Analysis of developing..." is described with the fields as shown below:
Here for each analyzed plant or genotype a column is used for its description. Here it is important that the plant number is correctly filled in row 11. The plants should be correctly numbered, beginning from 1 for the plant in column B. No row should be left empty in-between. The numbers in row 11 are used for the correct reference of the source plants for the measurement values.
The following fields have to be filled:
- Species: The name of the analyzed species
- Genotype: The genotype of the analyzed plant
The following fields may be filled:
- Variety: the variety of the analyzed plant
- Growth conditions: a description or keyword for the growth conditions of the plant
- Treatment: a description or a keyword for the treatment of the plant (e. g. "water stress")
Input of measurement values
For each measured substance a new column, beginning from column F needs to be filled. If the source data layout has the analyzed substances in rows instead of columns it is possible to exchange rows with columns with the corresponding transform command in the spreadsheet application. In MS-Excel, OpenOffice and Gnumeric such an option is available with the command "Edit/Paste Special...". The layout of this input table is shown below:
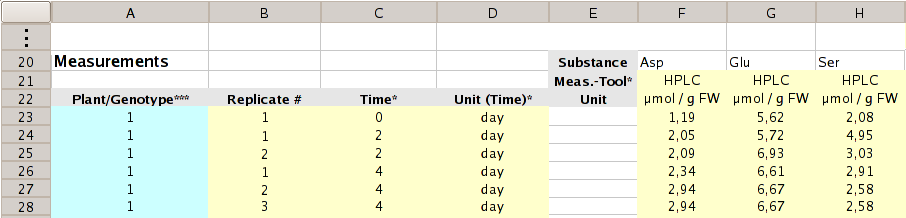
The input table for the measurement values is filled as follows:
In column A (Plant/Genotype) the plant/genotype number needs to be entered. With this number a reference of the measurements to the particular plant is made.
The next column B holds a optional replicate number. This number may help the user to identify the different replicates of the measurement for example at a later time point. Additionally this number is important for certain operations during a correlation analysis.
The columns C and D (Time, Unit (Time)*) are optionally filled with time series data. A number of measurements may be made at different time intervals, by entering data in these columns the dataset is divided into different time points which may be then analyzed independently or may be used for time series analysis. Important: the time values need to be integer values. E.g. use "30"-"Seconds" instead of "0.5"-"Minutes". Also please use for all time points the same time unit, otherwise the time values may not be sorted correctly and thus displayed in a not desired order, also calculations do not consider different time units. VANTED does not know if 3 "Minutes" is greater than 60 "Seconds" (it compares 60 to 3, without knowing a order of all possible time units).
From column F on the analyzed substance names need to be entered in row 20. Optionally the tool used for the measurement may be mentioned in row 21. In row 22 the measurement unit has to be entered. All measurement values for a single substance need to get the same measurement unit. To avoid errors it is not recommended to use more than one column for the same substance.
The measurement values for the different plants are entered in separate rows, beginning with row 23. It is possible to enter more than one measurement value for a single plant and time point. This way replicates are defined. In the application these replicate values are correctly handled, the mean value and standard deviation is calculated while importing the input form and is used for different analysis algorithms and statistical calculations like the t-test. Also in the visualization of the data in the form of bar or line charts the standard deviation may be displayed. It is recommended not to enter mean values in the input form, but if available all replicate measurement values. While entering the measurement values no row should be left completely empty.
It is highly recommended to compare the number of measurement values entered in the Excel form, with the number of measurement values, which is displayed after loading of the input form. If these values differ, the input form should be checked for input errors, like empty rows or columns or formatting errors.
In case of import errors the command Help/Error Messages should be used to display the corresponding error messages.